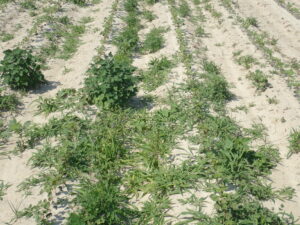
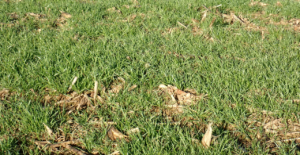
What Are the Pale Patches in Wheat Fields This Year?
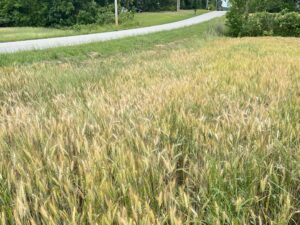
Across the state we have seen some pale patches in wheat fields. This article describes some of the more …


El inglés es el idioma de control de esta página. En la medida en que haya algún conflicto entre la traducción al inglés y la traducción, el inglés prevalece.
Al hacer clic en el enlace de traducción se activa un servicio de traducción gratuito para convertir la página al español. Al igual que con cualquier traducción por Internet, la conversión no es sensible al contexto y puede que no traduzca el texto en su significado original. NC State Extension no garantiza la exactitud del texto traducido. Por favor, tenga en cuenta que algunas aplicaciones y/o servicios pueden no funcionar como se espera cuando se traducen.
Inglês é o idioma de controle desta página. Na medida que haja algum conflito entre o texto original em Inglês e a tradução, o Inglês prevalece.
Ao clicar no link de tradução, um serviço gratuito de tradução será ativado para converter a página para o Português. Como em qualquer tradução pela internet, a conversão não é sensivel ao contexto e pode não ocorrer a tradução para o significado orginal. O serviço de Extensão da Carolina do Norte (NC State Extension) não garante a exatidão do texto traduzido. Por favor, observe que algumas funções ou serviços podem não funcionar como esperado após a tradução.
English is the controlling language of this page. To the extent there is any conflict between the English text and the translation, English controls.
Clicking on the translation link activates a free translation service to convert the page to Spanish. As with any Internet translation, the conversion is not context-sensitive and may not translate the text to its original meaning. NC State Extension does not guarantee the accuracy of the translated text. Please note that some applications and/or services may not function as expected when translated.
Collapse ▲Across the state we have seen some pale patches in wheat fields. This article describes some of the more …
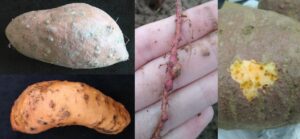
Nothing beats the delicious and nutritious sweetpotatoes from North Carolina. Yet the guava root-knot nematode (GRKN; Meloidogyne enterolobii) continues …
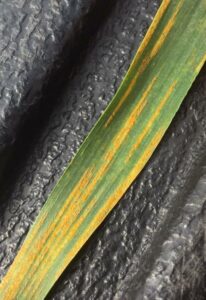
Stripe rust has appeared in eastern North Carolina. It was found April 17th in field plots of DG Shirley …
Botrytis blight (caused by Botrytis cinerea) is a well-known problem among greenhouse ornamental crop producers. This ubiquitous fungus has …

A recent study from the University of Florida discovered high incidences of two tomato viruses (ToBRFV and PepMV) in …
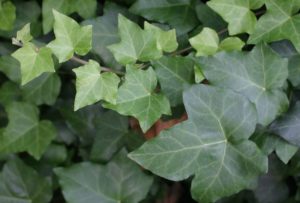
English ivy (Hedera helix) creates a dense ground cover with attractive dark green foliage. But, left unchecked this introduced …
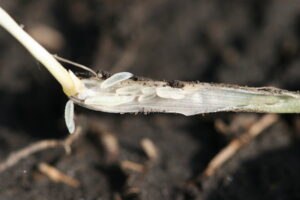
by D. Reisig, A. Post, and Ryan Heiniger Hessian fly is a serious pest of North Carolina wheat. A description …
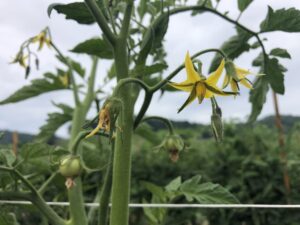
The fungicide spray guides for tomato and pepper are intended for commercial growers and are suggested products or programs …
North Carolina Cooperative Extension of Chatham County is conducting a webinar on March 12 for farmers interested in renewable energy and energy …

EPA just issued an existing stocks order for Engenia, Tavium, and XtendiMax, previously labeled for use in dicamba-tolerant cotton …
A Federal district court in Arizona issued an order on February 6 to vacate labels for Engenia, Tavium, and …
RALEIGH, N.C. — Consumer preferences in floral arrangements don’t necessarily match the designs that florists are taught to make, …
The American Sheep Industry Association will once again offer grants to developing shearers. Experienced shearers are also eligible to apply …
RALEIGH, N.C. — The tree fruit entomology group in the eastern US is beginning collaborative work to develop new and updated …
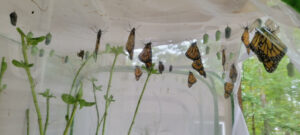
Have you ever wanted to raise Monarch butterflies? How about 237 monarchs released from your very own fingertips? Well, …
Planting a crop requires substantial up-front investment, yet the farmer will not know how much they will earn until …

Grant Program Overview NC AgVentures is an NC State Extension grant program that provides grants to North Carolina family farms, …

The 75th Annual Crop Protection School will be held virtually (via Zoom) Thursday, November 30, 2023. Registration is free …
Knowing our customers is one of the most important aspects of marketing, even in grain crops. The NC Small Grain …
Early this week, I got together with Drs. Tom Barber (University of Arkansas) and Jason Bond (Mississippi State University) …